Synteny Viewer
CGD uses the Tripal Synteny Viewer, developed by the Fei Bioinformatics Lab, to display the analysis results of Citrus and Liberibacter genomes that were compared using the program MCScanX. Synteny Viewer is accessed under the "Tools" menu (Fig. 1A) or via a link on the Species Overview page.
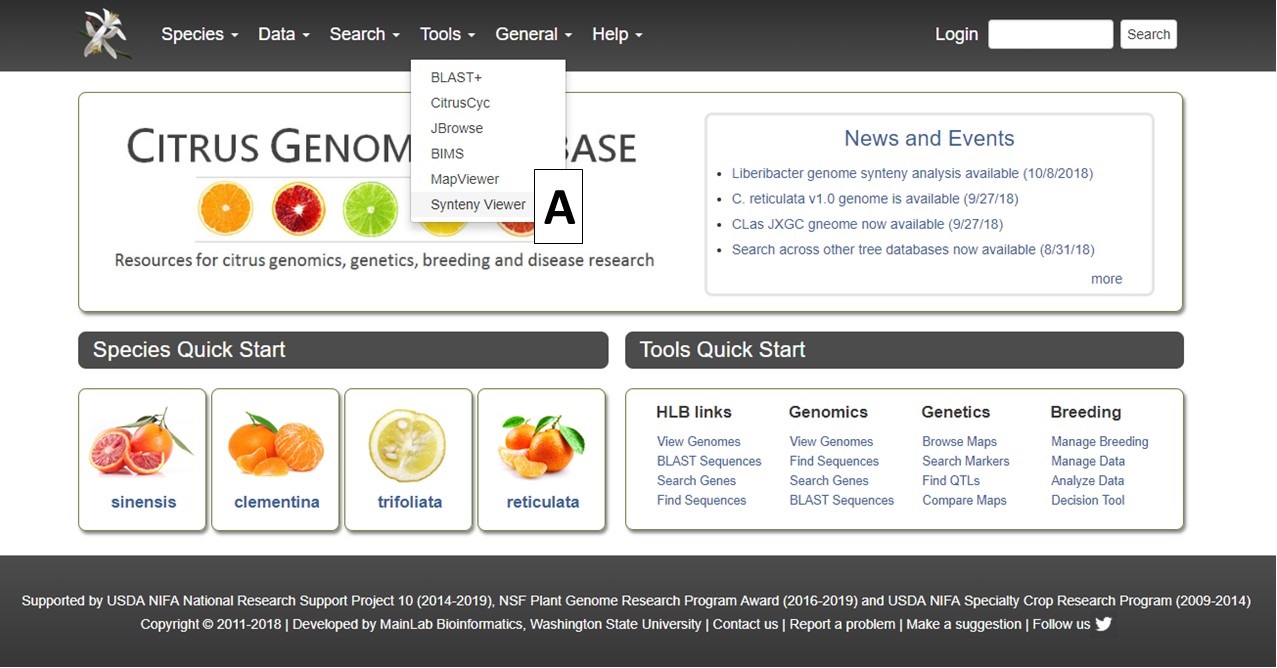
Figure 1. Accessing Synteny Viewer on CGD.
On the Synteny Viewer interface, there is some information about the tool and a pull-down menu to select the Organism Type (Fig. 2A) of "Plant" or "Bacteria" (Fig. 2B). The "Plant" option allows for the comparison of Citrus sp. genomes and the "Bacteria" option is for comparing genomes of the Ca. Liberibacter sp. and Liberibacter sp. If the block ID number is already known, the block ID value can be input directly to return just those results.

Figure 2. Selecting plant or bacteria genome option.
Once the organism is selected, another pull-down menu becomes available to select the first genome for comparison (Fig. 3A). After selecting the genome, the "Chromosome/Scaffold" menu will populate with the names of the appropriate scaffolds or chromosomes and one of the sequences can be selected (Fig. 3B). The final option is to select one or more genomes for comparison (Fig. 3C), and then the "Search button" is clicked to start the search (Fig. 3D).
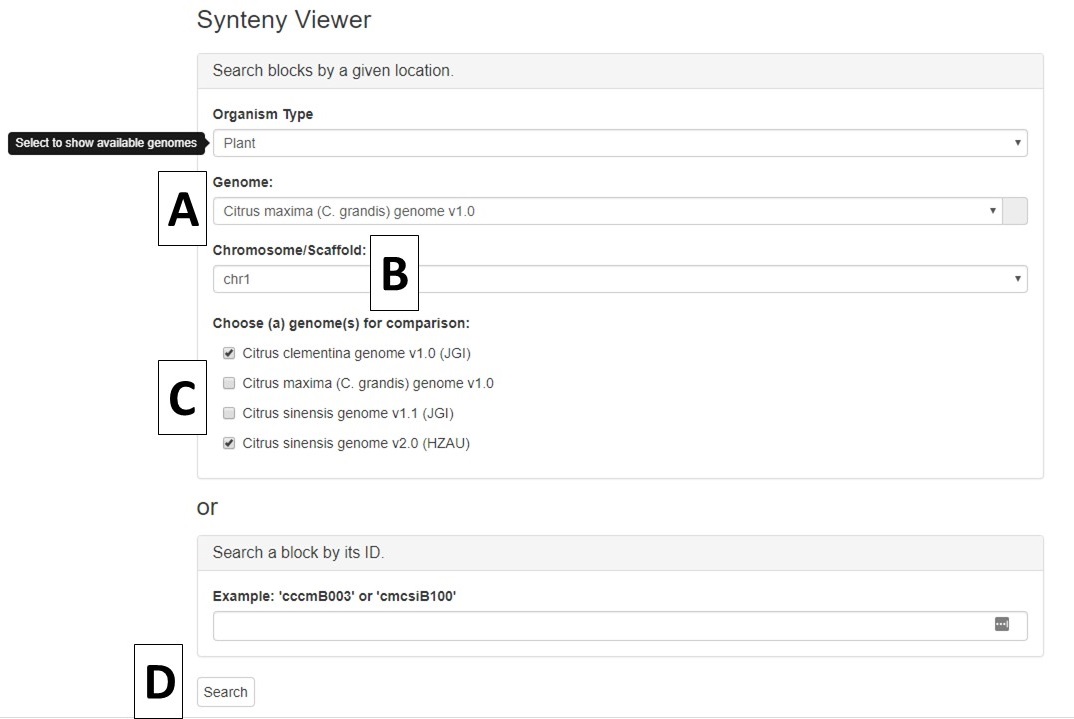
Figure 3. Options for Synteny Viewer search.
When the search is complete, a new page opens with the results. There is a summary of the input settings at the top of the page (Fig. 4A). When multiple genomes are queried, there are tabs to switch between the results (Fig. 4B) and the circular graph (Fig. 4C) will change when a different genome is selected. The syntenic regions are indicated on the circular graph by gray lines. When the mouse hovers over the gray line, a summary is displayed (Fig. 4D). Clicking on the gray lines, opens a page with more details (see below, Fig. 6).
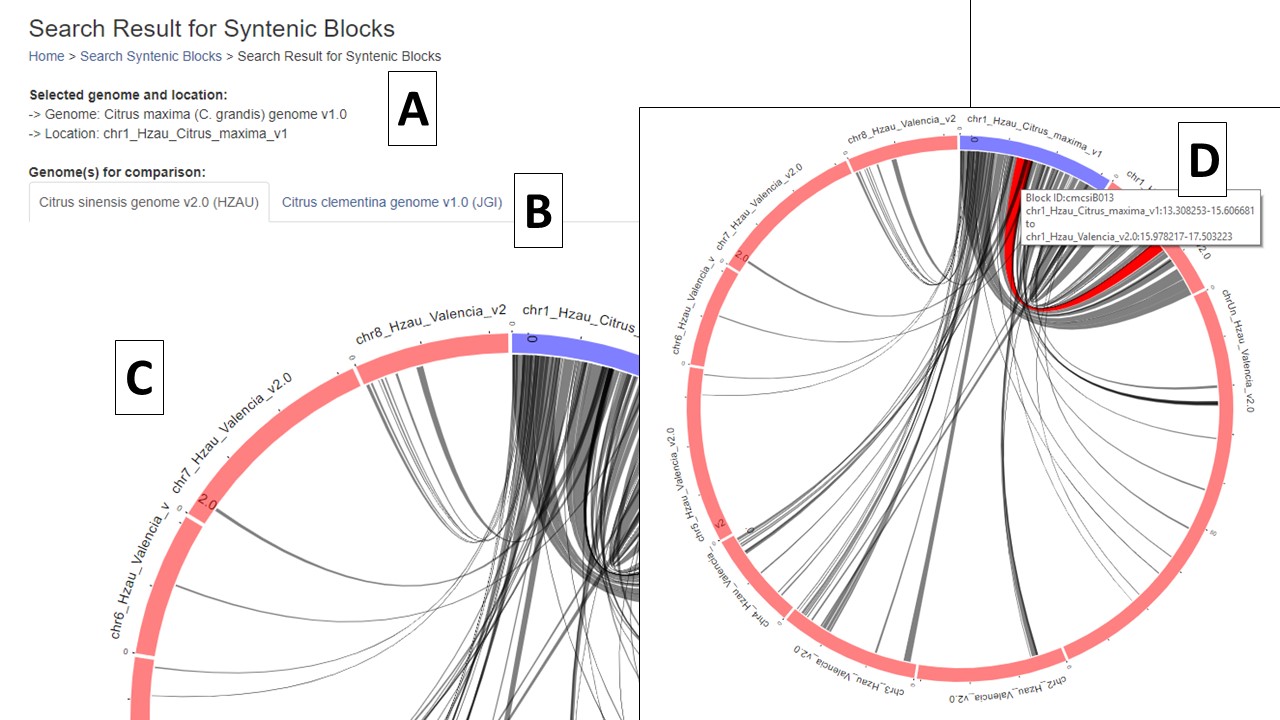
Figure 4. Synteny results and circular graphs.
Under the circular graph is a table listing the syntenic blocks that are displayed as gray lines in the circular graph. Clicking on the block name (Fig. 5A) opens the same details page as clicking on the gray lines on the circular graph.
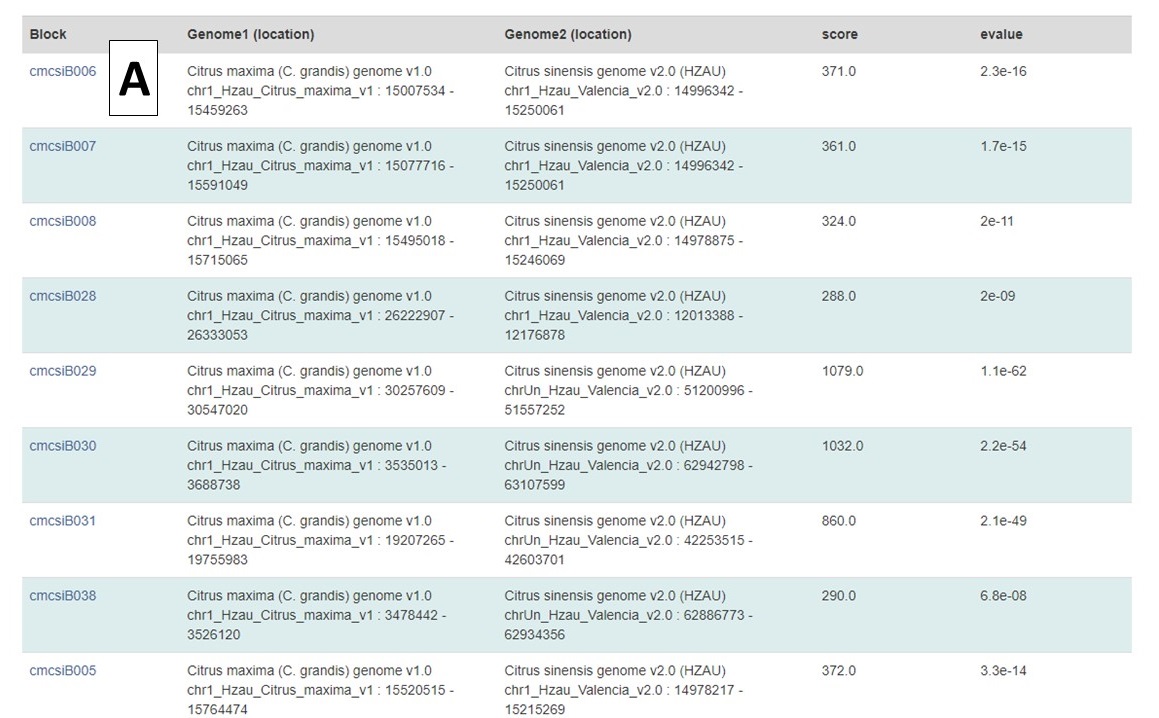
Figure 5. Synteny block list.
The syntenic block details page has an overview section at the top listing the details for each genome in the comparison (Fig. 6A), a side-by-side graphic of the syntenic block from each genome (Fig. 6B), and a table showing the genes in the syntenic block from each genome (Fig. 6C). Clicking on the gene name in either the table or on the graphic will open the feature details page from the CGD database.
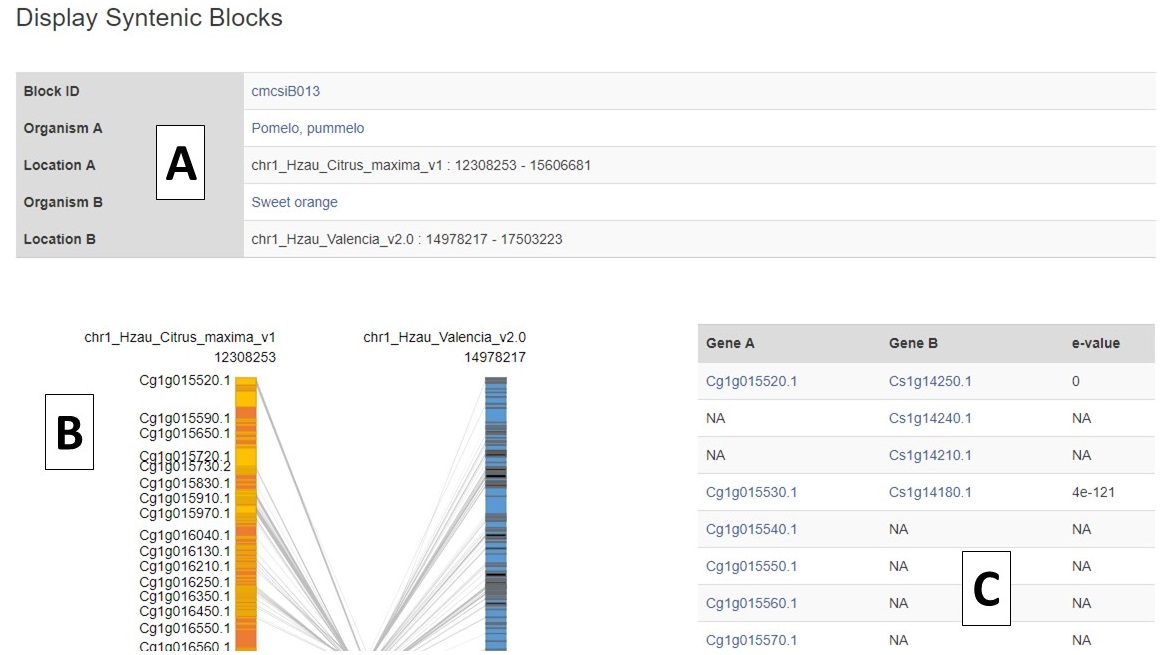
Figure 6. Syntenic Block Details Page.
The side-by-side graph can be zoomed (Fig. 7) using the scroll wheel on the mouse and the view can be shifted up or down by click and dragging.
.jpg)
Figure 7. Zoomed in view of graph.